OpenTelemetry-JS Tracing 实现详解
Table of Contents
1. OpenTelemetry 是什么? #
OpenTelemetry 是由 OpenTracing 和 OpenCensus 合并而成, 前身之一 OpenTracing 则是 CNCF 的一个 tracing 方向的孵化项目. OpenTelemetry 对自己的定义是一个大而全的可观测性框架.
2. Tracing 是什么? #
系统的可观测性(Observability)一般指 Logging, Metrics, Tracing. Tracing 也就是链路追踪往往是距离我们最遥远的, 因为实现起来比另外两个难得多.
微服务时代, 一个外部请求需要内部若干服务的联动响应, 这时候完整的调用轨迹将跨越多个服务, 同时包括服务间的网络传输信息与各个服务内部的调用堆栈信息. 追踪的主要目的是排查故, 如分析调用链的哪一部分、哪个方法出现错误或阻塞, 输入输出是否符合预期, 等等.
例如: A 服务收到用户请求, 通过 grpc 调用了 B 和 C 服务, B 服务读写了数据库, 然后再通过 http 请求了 D. 有了追踪理论上我们可以知道这个请求以上各个步骤分别从何时开始用了多久, 有没有出现错误.
3. Tracing 时序图(效果) #
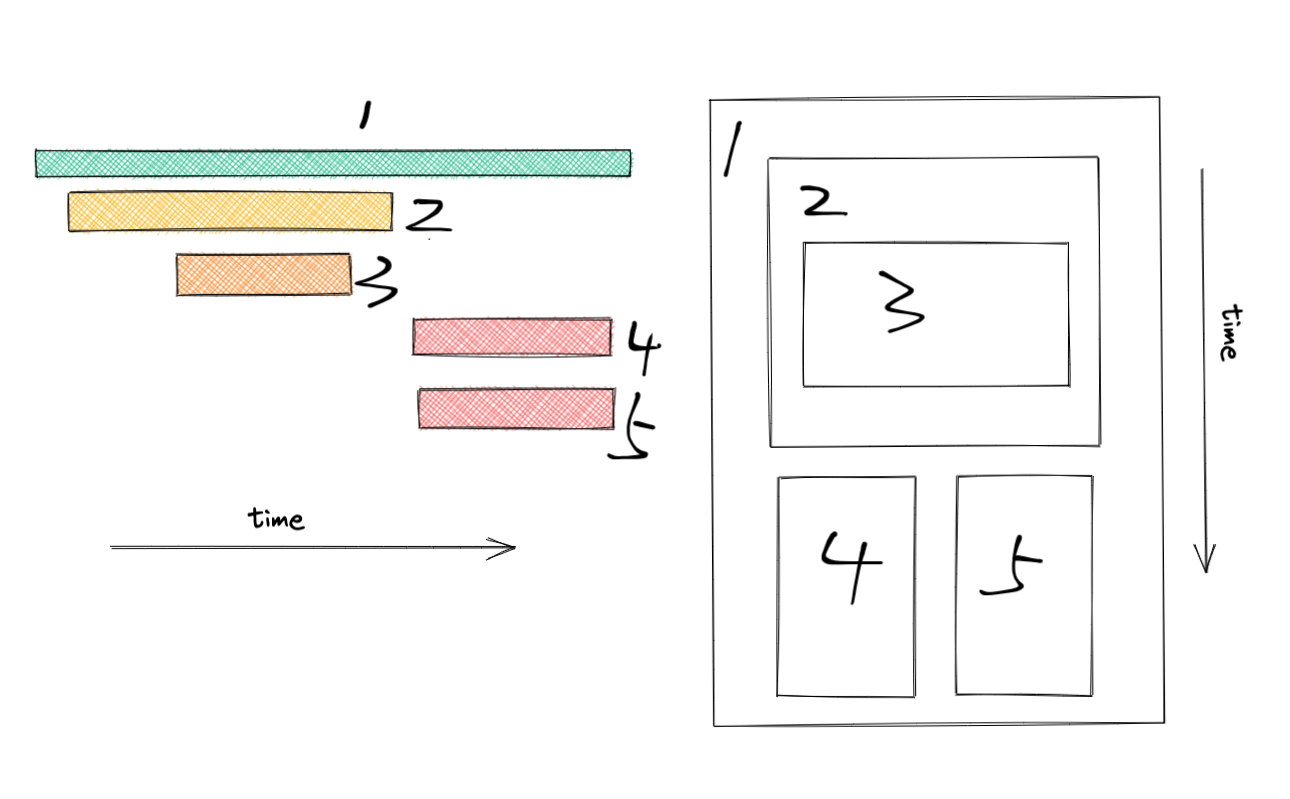
根据上图可以想象: 一个请求进来被 http server handler (1) 处理, 1 调用了函数 2, 函数 2 内做了数据库操作 3, 之后并发调用函数 4 和 5, 结束后 1 返回请求响应.
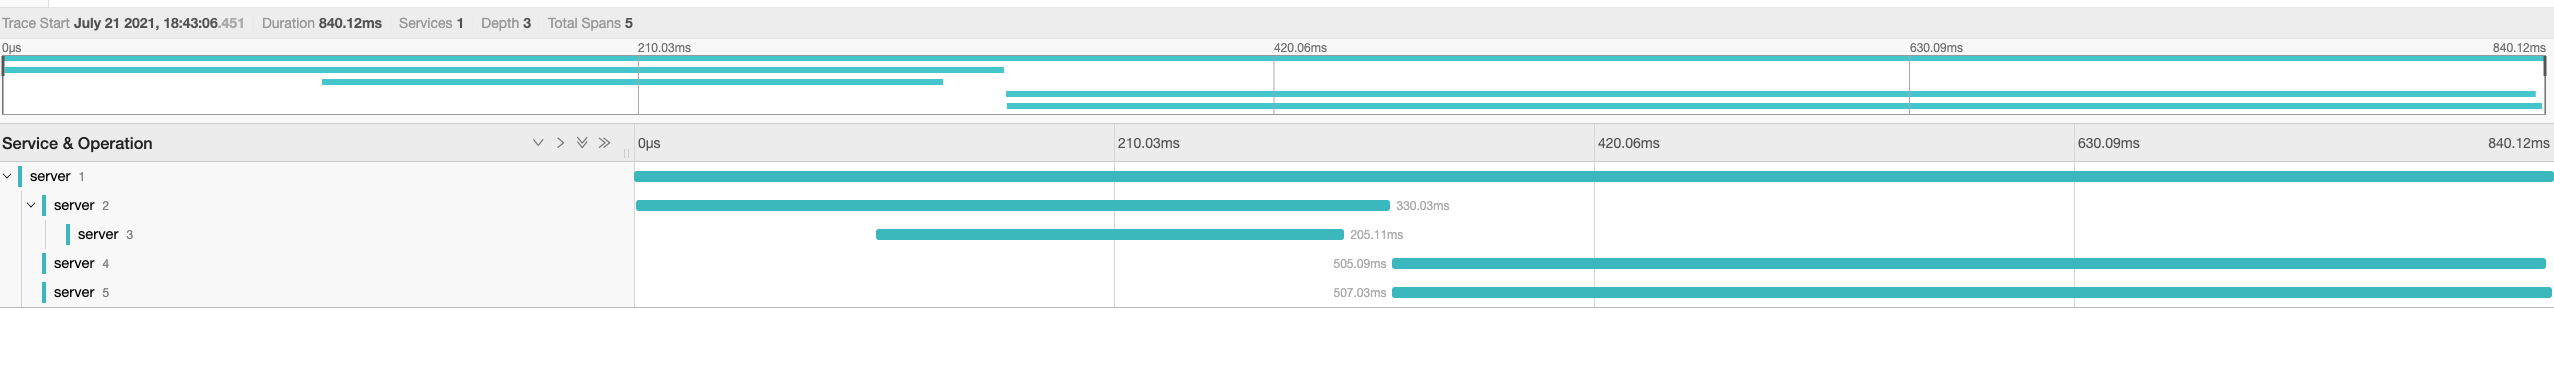
3.1 数据格式 #
是一个树形结构, 以 jaeger 为例, references 记录父子层级关系, startTime 和 duration 记录 span 执行时间. 删掉不相关字段后如下:
{
  "data": [
    {
      "traceID": "fb2d2bbff8c53ddb2d9aa25cabad22fd",
      "spans": [
        {
          "traceID": "fb2d2bbff8c53ddb2d9aa25cabad22fd",
          "spanID": "76aaa1e18584ecb1",
          "operationName": "2",
          "references": [
            {
              "refType": "CHILD_OF",
              "traceID": "fb2d2bbff8c53ddb2d9aa25cabad22fd",
              "spanID": "ca8d5cedee0f6241"
            }
          ],
          "startTime": 1626922994782859,
          "duration": 329844
        },
        {
          "traceID": "fb2d2bbff8c53ddb2d9aa25cabad22fd",
          "spanID": "22b6b3a3942abc66",
          "operationName": "3",
          "references": [
            {
              "refType": "CHILD_OF",
              "traceID": "fb2d2bbff8c53ddb2d9aa25cabad22fd",
              "spanID": "76aaa1e18584ecb1"
            }
          ],
          "startTime": 1626922994888037,
          "duration": 200680
        },
        {
          "traceID": "fb2d2bbff8c53ddb2d9aa25cabad22fd",
          "spanID": "ca8d5cedee0f6241",
          "operationName": "1",
          "references": [],
          "startTime": 1626922994781944,
          "duration": 836854
        },
        ...
      ]
    }
  ]
}
4. 实现原理 #
了解了 tracing 数据结构, 可以知道它收集的核心信息是: 开始时间, 持续时间和父子层级关系. 其实是要做 定义某一个代码块为一个 span 开始时 startSpan 结束时调用 endSpan, 如果需要子 span 则要以当前 span 为 parent 将关系处理好, 很像代码块中的局部变量.
// 伪代码
{
  let span = { parent: null, name: 'root' }

  {
    // child 1
    const parent = span
    let span = { parent, name: 'child-1' }
    // do child 1 work

    span.end()
  }

  // do root work

  span.end()
}
4.1 AsyncLocalStorage 管理 local span #
AsyncLocalStorage 相当于 java 的 ThreadLocal. 区别就是 java ThreadLocal 是基于线程级别隔离的, 而 js 则可以基于异步函数块做隔离.
const scope1 = '1'
const scope2 = '2'
const scope3 = '3'
const scope4 = '4'

await contextManager.with(scope1, async () => {
  expect(contextManager.active()).toStrictEqual(scope1)
  await contextManager.with(scope2, async () => {
    expect(contextManager.active()).toStrictEqual(scope2)
    await contextManager.with(scope3, async () => {
      expect(contextManager.active()).toStrictEqual(scope3)
      await contextManager.with(scope4, async () => {
        expect(contextManager.active()).toStrictEqual(scope4)
      })
      expect(contextManager.active()).toStrictEqual(scope3)
    })
    expect(contextManager.active()).toStrictEqual(scope2)
  })
  expect(contextManager.active()).toStrictEqual(scope1)
})
zcong1993/context-async-hooks/index.test.ts#L161
可以看到 contextManager.with(ctx, asyncFn) 函数能够保证在 asyncFn 函数中调用 contextManager.active() 函数始终只能够拿到 with 函数设置的 ctx.
同理, 用上面的方式管理 span, context.active() 永远能够拿到当前 scope 的 span 对象(记作 active span).
需要注意的是: 如果使用简单 object 作为 context, 由于 js 对象是引用, 所以在嵌套时, 嵌套层的修改也会影响外层拿到的值.
const cm = createAsyncContextManager<any>()
const a: any = { span: 'root' }
await cm.with(a, async () => {
  console.log('before child', cm.active()) // before child { span: 'root' }
  await cm.with(a, async () => {
    a.span = 'child' // modify field here
    console.log('in child', cm.active()) // in child { span: 'child' }
  })
  // 我们需要拿到 { span: 'root' }
  console.log('after child', cm.active()) // after child { span: 'child' }
})
所以 opentelemetry-js 的 context 使用 Map 类型, 在处理 context 修改时会复制一份, 相当于 immutable.
class BaseContext implements Context {
  private _currentContext!: Map<symbol, unknown>

  constructor(parentContext?: Map<symbol, unknown>) {
    // for minification
    const self = this

    self._currentContext = parentContext ? new Map(parentContext) : new Map()

    self.getValue = (key: symbol) => self._currentContext.get(key)

    self.setValue = (key: symbol, value: unknown): Context => {
      const context = new BaseContext(self._currentContext)
      context._currentContext.set(key, value)
      return context
    }

    self.deleteValue = (key: symbol): Context => {
      const context = new BaseContext(self._currentContext)
      context._currentContext.delete(key)
      return context
    }
  }
}
opentelemetry-js-api/src/context/context.ts#L30
tracer.startSpan() 默认会以 active span 作为 parent 创建出子 span, 层级关系就这样有了, 最后用 context.with(ctx, fn) 使函数在 scope 中执行(封装的 asyncLocalStorage.run 方法):
startSpan(
  name: string,
  options: api.SpanOptions = {},
  context = api.context.active()
): api.Span {
  // 尝试从 context.active() 中拿到 parent Span
  const parentContext = getParent(options, context);
  const spanId = this._idGenerator.generateSpanId();
  let traceId;
  let traceState;
  let parentSpanId;
  if (!parentContext || !api.trace.isSpanContextValid(parentContext)) {
    // New root span.
    traceId = this._idGenerator.generateTraceId();
  } else {
    // New child span.
    traceId = parentContext.traceId;
    traceState = parentContext.traceState;
    parentSpanId = parentContext.spanId;
  }

  const span = new Span(
    this,
    context,
    name,
    spanContext,
    spanKind,
    parentSpanId,
    links,
    options.startTime
  );

  // ...
  return span;
}
opentelemetry-sdk-trace-base/src/Tracer.ts#L64
根据上面原理分析, tracing 伪代码如下:
const span = tracer.startSpan(spanName, spanOptions)

const run = async (name: string, fn: () => Promise<any>) => {
  const span = tracer.startSpan(name)

  return context.with(trace.setSpan(context.active(), span), async () => {
    try {
      await fn()
    } finally {
      span.end()
    }
  })
}
4.1.1 额外处理 EventEmitter #
默认情况下 EventEmitter callback 执行时上下文是不确定的, 但是我们需要 context 来维护层级关系, 所以需要额外为所有 callback 绑定当前 context.
为事件 callback 绑定 scope 实现细节查看 AbstractAsyncHooksContextManager.ts#L97.
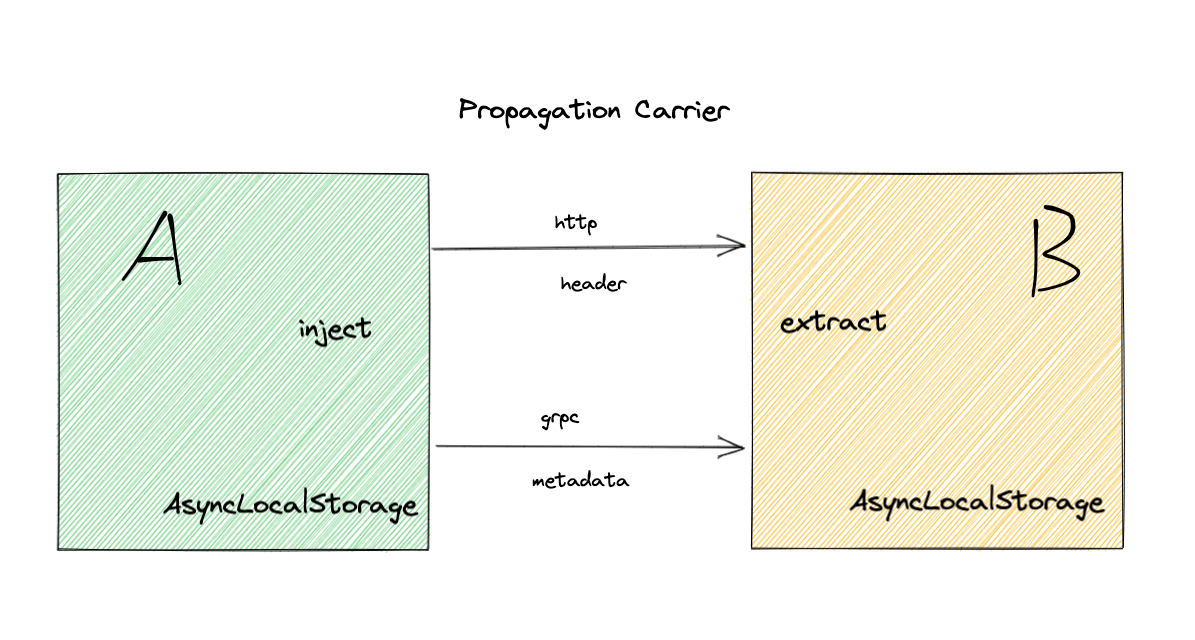
4.2 跨服务传播 #
跨服务传播需要根据协议选择 carrier, 并且通过 PropagationAPI 进行注入或者读取.
http 协议选择 header 作为 carrier, grpc 使用 metadata.
核心为下面两个方法:
- inject 负责将当前 context 中的 span 信息注入 carrier 发送给另一个服务
- extract 负责从接收到的 carrier 中还原 span 信息
interface PropagationAPI {
  /**
   * Inject context into a carrier to be propagated inter-process
   *
   * @param context Context carrying tracing data to inject
   * @param carrier carrier to inject context into
   * @param setter Function used to set values on the carrier
   */
  inject<Carrier>(
    context: Context,
    carrier: Carrier,
    setter?: TextMapSetter<Carrier>
  ): void
  /**
   * Extract context from a carrier
   *
   * @param context Context which the newly created context will inherit from
   * @param carrier Carrier to extract context from
   * @param getter Function used to extract keys from a carrier
   */
  extract<Carrier>(
    context: Context,
    carrier: Carrier,
    getter?: TextMapGetter<Carrier>
  ): Context
}
跨服务通过 carrier 传播 span 信息, 服务内部通过 AsyncLocalStorage 传递 span
可通过打印 grpc metadata 看到传递的 span 信息(下面为默认格式):
{
  // 00-traceId-spanId-01
  traceparent: '00-5f2c391594a2aab0405f2717bb3f5edf-465073d693b58b16-01'
}
4.2.1 instrumentation-grpc 相关代码 #
server 端 extract 代码:
context.with(
  propagation.extract(ROOT_CONTEXT, call.metadata, {
    get: (carrier, key) => carrier.get(key).map(String),
    keys: (carrier) => Object.keys(carrier.getMap()),
  }),
  () => {
    // run origin server handler in span context
  }
)
client 端 inject 代码:
export function setSpanContext(metadata: grpcJs.Metadata): void {
  propagation.inject(context.active(), metadata, {
    set: (metadata, k, v) => metadata.set(k, v as grpcJs.MetadataValue),
  })
}
4.3 instrumentation 实现原理 #
js 相关 instrumentations
instrumentation 通过 monkey patch 形式更改相应的库进行无感知 tracing 注入, 自动做到以下几点:
- 在某个 handler 开始时调用 startSpan, 结束时调用 endSpan, 并保证 handler 在 span scope 中执行
- 库做跨服务沟通时, inject 或者 extract 进行 span 传递和转换
- 增加 span kind attributes 等信息
例如: instrumentation-http 会将 node http/https http server 和 client 相关函数 patch 掉
- 保证 http server handler 和 client request 在相应的 span 中执行
- inject extract 转换 header 和 span
- 增加 attributes 如: ip port method path status
5. 如何使用 #
由于 instrumentation 使用 monkey patch 实现, 所以需要在 patch 库之前执行, 某些框架有自己的加载器, 没有一个入口文件, 所以建议单独定义一个 trace.js 文件, 使用 node --require trace.js app.js 启动应用, 框架基本都有给 node 传递 require 文件的方法.
opentelemetry-js 正在经历了 0.x 版本到 1.0 版本的过渡, 所以非常多的 BREAKING CHANGE, API 变化非常大, 本文已经将代码更新为 1.0 版本新 API 形式, 如果后续有冲突请以官方文档为准.
import { JaegerExporter } from '@opentelemetry/exporter-jaeger'
import { BatchSpanProcessor } from '@opentelemetry/sdk-trace-base'
import { NodeSDK } from '@opentelemetry/sdk-node'
import { getNodeAutoInstrumentations } from '@opentelemetry/auto-instrumentations-node'

// 环境变量配置, 完整列表可见下面链接
// https://github.com/open-telemetry/opentelemetry-js/blob/3045eba229f031e1510785dbb9713f24daf17ed1/packages/opentelemetry-core/src/utils/environment.ts
// 定义 service 名称
process.env.OTEL_SERVICE_NAME = 'test-service'
// 定义日志级别
process.env.OTEL_LOG_LEVEL = 'ALL'

const main = async () => {
  // 定义 tracing 输出服务, zipkin 选择 ZipkinExporter
  const exporter = new JaegerExporter({
    endpoint: 'http://localhost:14268/api/traces',
  })

  const sdk = new NodeSDK({
    // SimpleSpanProcessor 每个 span 发一个请求, 性能很低, 生产环境不要用
    // provider.addSpanProcessor(new SimpleSpanProcessor(exporter))
    // BatchSpanProcessor 批处理, 生产环境使用
    spanProcessor: new BatchSpanProcessor(exporter),
    instrumentations: [
      // 注册需要的 instrumentations
      // @opentelemetry/auto-instrumentations-node 可以帮我们自动注入一些内置模块和通用模块
      // 详情可查看文档
      // https://github.com/open-telemetry/opentelemetry-js-contrib/tree/main/metapackages/auto-instrumentations-node
      getNodeAutoInstrumentations(),
    ],
  })

  await sdk.start()

  console.log('[trace] initialized')

  // gracefully shut down the SDK on process exit
  process.on('SIGTERM', () => {
    sdk
      .shutdown()
      .then(() => console.log('[trace] terminated'))
      .catch((error) => console.log('[trace] Error terminating tracing', error))
  })
}

main()
注意: jaeger batch UDP processor 注意调整 sysctl net.inet.udp.maxdgram
sudo sysctl net.inet.udp.maxdgram=65536
5.1 Sampler 配置 #
生产环境请求量很大, 而且很多时候没必要所有请求都配置追踪, 可以通过 sampler 配置采样比率.
官方文档 opentelemetry-core#built-in-sampler.
OTEL_TRACES_SAMPLER 和 OTEL_TRACES_SAMPLER_ARG 环境变量可以直接控制内置采样器, 也可以实现自己的采样器
6. 个人感受与产出 #
OpenTelemetry Tracing 方面能够做到无侵入使用体验非常好, 但是 Metrics 方面就没必要使用了, 首先 Prometheus 生态已经非常成熟而且使用扩展起来很简单, 其次 OpenTelemetry Metrics 自己定义了一套指标类型然后通过适配器转化成 Prometheus metrics 个人感觉没什么必要.
从源码阅读体验来说, 是非常痛苦的. 因为抽象了太多东西导致源码分散在了无数个 npm 包, 而且正在经历 0.x 到 1.0 过渡时期, 包名和源码位置变动都很大. 随处可见的 interface, 并且很多地方采用全局 provider register 来管理, 这些都是比较好的设计模式.
但是也有反常规的地方, 例如 opentelemetry-context-async-hooks 这个包封装了不同 node 版本的 context manager, 我下意识认为这个包是纯高层抽象, 来管理抽象的上下文类型应该是 AsyncLocalStorageContextManager<T> 类型, 结果它直接耦合了 context 类型, 并且将 rootContext 默认值在这个层面返回, 导致当初我找 Context 实现时花费了很长时间, 可见源码. 这点也导致这个包不能共享出来在别的地方直接使用, 所以我 fork 了一个自己的版本 zcong1993/context-async-hooks, 也算阅读源码的一个产出.
而另一个产出是 opentelemetry-instrumentation-egg, 为 egg.js 框架写了个 instrumentation, 并且已经用于我们公司项目中了. 由于 egg.js 底层是基于 koa, 所以实现起来和 opentelemetry-instrumentation-koa 差不多.